Speaking at the opening ceremony of the United Nations Climate Change Conference COP24 in Katowice, Poland, Sir David Attenborough, a famous BBC broadcaster best known as a presenter of nature documentaries, called climate change “our greatest threat in thousands of years”. Over the next two weeks, world leaders are gathering in Poland to negotiate how to deal with this threat and tackle climate change at a global level.
Just last week, a UN report found that global carbon dioxide emissions rose for the first time in four years. “Now more than ever, unprecedented and urgent action is required by all nations. The assessment of actions by the G20 countries indicates that this kind of action is yet to happen”, the UN’s 2018 Emissions Gap Report finds, warning that the goals set in the Paris Agreement—limiting global warming to 2 degrees Celsius above pre-industrial levels this century while aiming to stay below a 1.5 degree temperature rise—are getting harder and harder to achieve.
Finding a global action plan against climate change is as necessary as it is difficult. As the following chart illustrates, per capita CO₂ emissions vary vastly across countries, making it difficult to come up with a plan to limit emissions at a global level without hurting the development prospects of emerging economies that (perhaps rightfully) feel limited responsibility for the climate crisis.
The Global Disparity in Carbon Footprints
This chart shows per capita CO₂ emissions in the world's largest economies in 2016.
Dec 4, 2018

Latest in Global

Sponsored
Strengthen Your Manufacturing Sales Resiliency
June 1, 2026

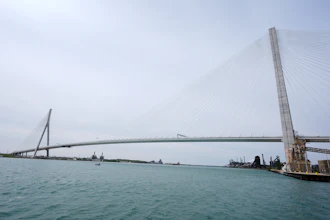
Opening of Canada-U.S. Bridge in Detroit Delayed
June 11, 2026


China’s Exports Jump 19.4% in May
June 10, 2026